
Hubspot
Summarize this blog post with:
THE PROBLEM THIS GUIDE SOLVES
Actionable HubSpot reporting means every dashboard your team opens tells them specifically what to do next, not just what happened last week. Most HubSpot reporting setups fail this test. They look complete, show real data, and drive nothing because nobody has applied the one rule that separates a useful report from an expensive decoration: every chart must lead to a specific decision.
Your HubSpot reports are full of data and empty of action. Your team opens the dashboard, looks at the numbers, and closes the tab without changing a single thing. This is not a HubSpot problem. It is a reporting design problem, and it is more common than most teams admit. Most teams under-use HubSpot reporting without realising it, according to Pixcell.io’s 2025 sales reporting analysis. The platform has more capability than the reports running in most portals suggest.
This guide diagnoses the four specific reasons your current reports are not driving decisions, gives you the Action-First framework for rebuilding them, explains the leading vs lagging distinction that changes what your team measures every week, shows you how to build MQL Velocity (the single most undertracked metric in HubSpot), and gives you the deletion rules that clear out the noise so the signals your team needs are visible. For context on why disconnected reporting is fundamentally a data integration problem before it is a dashboard design problem, read our guide on how HubSpot integration stops revenue leaks before starting any HubSpot reporting redesign.
WHAT THIS GUIDE COVERS
- Organizations with advanced analytics capabilities are 23 times more likely to outperform competitors in customer acquisition and 19 times more likely to achieve above-average profitability, per McKinsey’s analytics benchmark research cited in Stacksync’s 2026 HubSpot reporting guide. Most HubSpot reporting setups are not producing analytics. They are producing dashboards that satisfy the feeling of measurement without generating the outcome.
- The Action-First principle: Every HubSpot report must answer a specific question that leads to a decision. If a chart goes down and your manager does not know exactly which lever to pull, that chart does not belong on the dashboard.
- Revenue is a lagging indicator. By the time it appears in your HubSpot reporting, it reflects work done three months ago. The metrics your team needs to make decisions this week are pipeline creation velocity, MQL-to-first-touch time, and deal stage duration.
- A2Z Dev Center’s digital marketing services include HubSpot reporting audits, dashboard rebuilds, and MQL velocity configuration for teams whose current reports are generating observations, not decisions.
Why Is Your Team Not Using HubSpot Reports? (4 Specific Reasons)
Before rebuilding any HubSpot reporting setup, you need to know which of these four failure modes is the root cause. Each has a different fix. Applying the wrong fix to the wrong problem makes the dashboard more elaborate without making it more useful.
1
Vanity metrics dominate the dashboard
Email open rate. Website page views. Total contacts in the database. Social follower count. These are the metrics that populate most default HubSpot reporting setups because they are the easiest to access and the most impressive to screenshot. They are also the least actionable. When email opens drop, most teams look at it, say “opens are down,” and move on. There is no lever connected to that metric. Vanity metrics observe without informing. They satisfy the feeling of measurement without generating decisions. Per Solvios Technology’s January 2026 HubSpot audit analysis, dashboards focused on vanity metrics or generic reports consistently fail to drive team action.
2
The wrong person is looking at the right data
A sales manager who opens a dashboard showing marketing attribution, content engagement scores, and email deliverability rates has not been given useful information. They have been given the marketing team’s dashboard. Role-mismatched HubSpot reporting is one of the most common sources of dashboard abandonment. Teams build one comprehensive dashboard that is meant to serve everyone and ends up useful for no one. A HubSpot dashboard only drives decisions when it shows the person opening it specifically the information they are responsible for acting on. Sales managers need pipeline visibility. Marketing managers need MQL quality and source attribution. RevOps needs process efficiency. None of these audiences share a useful dashboard.
3
No report includes a next action
A HubSpot report that shows a number without connecting that number to a next action is a notification, not a tool. The design failure is not in what the report shows. It is in the absence of the question: “What do I do when this number changes?” CRM Magnetics’ April 2026 HubSpot reporting setup analysis frames this as the Action-First principle: every single report on a dashboard must answer a specific question that leads to a decision. If a chart goes down, does a manager know exactly what lever to pull? If a chart goes up, do they know how to replicate that success? If the answer is no, that report does not belong on the dashboard.
4
The underlying data is dirty and the team knows it
If your HubSpot reporting shows a pipeline number that your sales team does not trust because they know contacts are miscategorized, deal stages are inconsistently applied, and lead sources are partially blank, they will stop using the reports entirely. Not because the interface is poor. Because they have learned that the numbers are unreliable. Dirty data is the fastest way to destroy reporting adoption. According to Everbrave’s HubSpot dashboard guide, the most common underlying cause of unused HubSpot dashboards is not dashboard design but data quality: teams that do not trust their data will not act on it regardless of how well the charts are built.
What Is the Action-First Principle and How Do You Apply It to Every HubSpot Report?
The Action-First principle is the single rule that separates actionable HubSpot reporting from dashboard wallpaper. It states: every report on every dashboard must answer a specific question that leads to a specific decision. Reports that do not pass this test are either moved to a sandbox or deleted.
Here is how to run the Action-First test on every current report in your HubSpot reporting setup:
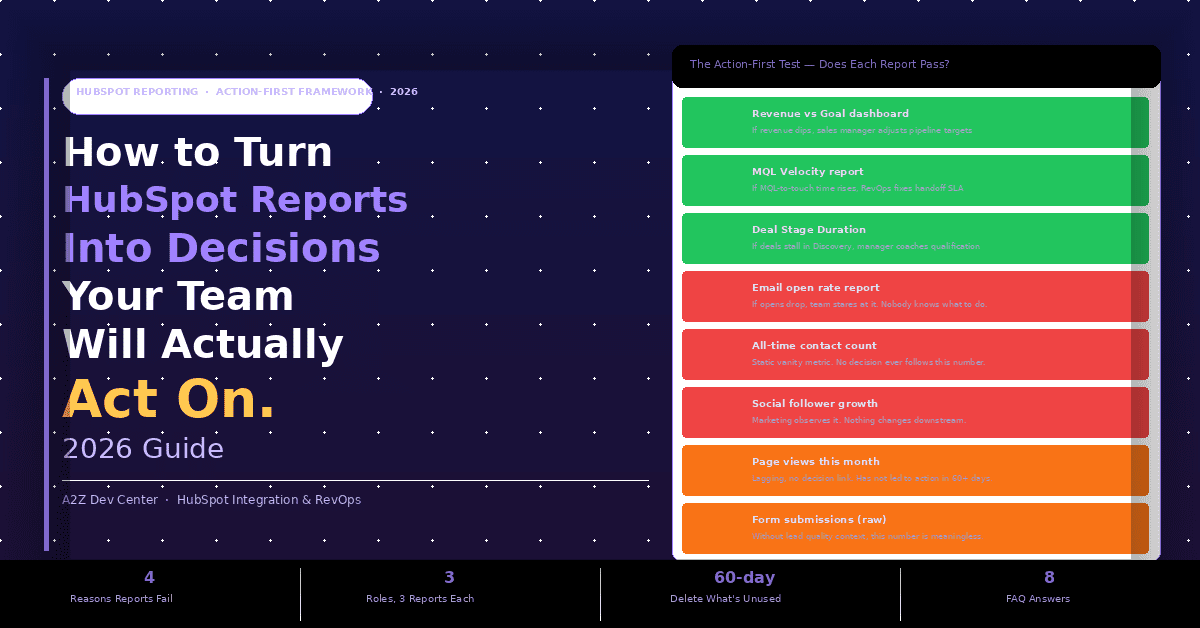
| VERDICT | REPORT | ACTION-FIRST TEST RESULT |
|---|---|---|
| PASS | Revenue vs Goal | Revenue dips below target this week, sales manager adjusts pipeline focus or escalates deal review |
| PASS | MQL Velocity | MQL-to-first-touch time rises above SLA, RevOps identifies the handoff breakdown and resets the process |
| PASS | Deal Stage Duration | Deals stuck in Discovery beyond benchmark triggers a specific coaching conversation with that rep |
| FAIL | Email open rate | If opens drop, team observes it. Nobody knows which lever to pull. No decision follows. |
| FAIL | All-time contact count | Static vanity metric. Growing the number feels good. No decision has ever followed this chart. |
| DELETE | Page views this month | Lagging, no decision link, has not led to any action in 60+ days. Remove from main dashboard. |
Run this test on every report currently visible in your HubSpot reporting dashboard. For each report, ask: “If this number changes significantly tomorrow, what does my team do differently?” If the answer is “we’d look at it,” the report fails. If the answer is a specific action with a named owner, it passes. Our performance marketing attribution guide applies this same action-first discipline to paid channel reporting, where the tendency to track engagement metrics instead of pipeline contribution is equally common.
Why Is Your Revenue Report Always 3 Months Old? Leading vs Lagging Indicators in HubSpot
Revenue is a lagging indicator. By the time it appears in your HubSpot reporting as a closed number, it reflects decisions made, campaigns run, and conversations held 60 to 90 days ago. If your revenue is down this month, you cannot fix it this month. You can only understand what happened. Leading indicators tell you what is likely to happen next month, next quarter, based on the process health you can see today. CRM Magnetics’ April 2026 HubSpot reporting guide makes this distinction central: “Pipeline creation velocity, meeting-to-opportunity conversion rates, and customer health scores are leading indicators. They tell you the future.”
LAGGING INDICATORS (WHAT HAPPENED)
Reflects the past, cannot change this period’s outcome
- Revenue closed this month
- Total deals won YTD
- Average deal size (historical)
- Churned MRR
- Customer acquisition cost (calculated after the fact)
LEADING INDICATORS (WHAT IS COMING)
Reflects current process health, can change next period’s outcome
- Pipeline creation velocity (new deals added this week)
- MQL-to-first-touch time (how fast sales responds)
- Meeting-to-opportunity conversion rate
- Deal stage average duration vs benchmark
- Active sequences per rep vs quota
The practical consequence is that a HubSpot reporting setup dominated by lagging indicators tells your team what already happened without giving them anything actionable to do about it this week. A setup built around leading indicators tells your team which process inputs are healthy and which ones are breaking down right now, before that breakdown shows up in the revenue line three months later. Most teams build their HubSpot dashboard to satisfy a CFO question (“what was revenue last month?”) rather than a RevOps question (“where is the process breaking this week?”). Both dashboards serve a purpose. But the RevOps dashboard is the one that drives weekly team action. Our HubSpot CRM migration guide addresses this during the migration itself: the data model you build determines which leading indicators you can track, and getting that architecture wrong at setup means rebuilding it 12 months later.
How Do You Build HubSpot Dashboards Your Team Will Actually Use? (The Role-Based Framework)
The fastest fix for dashboard abandonment is role-based segmentation. Build one dashboard per role and limit it to three to five reports that person is directly responsible for acting on every week. Not ten. Not fifteen. Three to five maximum. Each role’s HubSpot reporting dashboard should be answerable in under five minutes on a Monday morning and should produce at least one specific action before noon.
SALES MANAGER
Monday morning: 3 reports
- Pipeline by stage vs last week: Where did deals move? Where are they stuck?
- Deal Stage Duration (the Rot Report): Which deals have been in the same stage too long?
- Activity per rep vs quota: Who is below the activity threshold this week?
- Decision trigger: if any rep has deals stalled in the same stage for 2+ weeks, schedule a coaching conversation before Thursday.
MARKETING MANAGER
Monday morning: 3 reports
- MQL volume by source vs target: Which channels are delivering this week?
- MQL-to-SQL conversion rate: Are the leads being accepted by sales?
- Campaign attribution to pipeline: Which campaigns produced deals, not just leads?
- Decision trigger: if MQL-to-SQL rate drops below 30%, it is a lead quality issue, not a volume issue.
REVOPS / LEADERSHIP
Monday morning: 3 reports
- MQL Velocity: Average time from MQL date to first sales activity
- Pipeline creation velocity: New deals created this week vs target
- Forecasting: probability-weighted pipeline vs quota: Are we on track this month?
- Decision trigger: if MQL velocity exceeds a 48-hour SLA for 3 consecutive days, investigate the handoff process.
The 30% of marketing teams that prioritize data analysis and insights (HubSpot State of Marketing 2025) are largely operating off role-based dashboards. Teams that build a single “everyone” dashboard and wonder why nobody uses it are experiencing the predictable outcome of a design that attempts to serve all audiences and serves none. Our content marketing ROI guide applies the same role-based principle to content analytics: the CMO’s dashboard looks nothing like the content manager’s dashboard, because they are responsible for different decisions.
What Is MQL Velocity and How Do You Build It in HubSpot?
MQL Velocity is the single most undertracked metric in HubSpot reporting across mid-market organizations, and it is the one that identifies broken revenue processes before they show up in the pipeline number. It measures the average time between when a contact becomes an MQL and when a sales rep logs their first activity against that contact.
MQL VELOCITY FORMULA
MQL Velocity = Average(First Sales Activity Date – MQL Date)
In HubSpot, build this as a custom report using the Custom Report Builder. Object: Contacts. Metrics: Average time between “Became an MQL date” property and “First Sales Activity date” property. Segment by: Sales owner. Filter: MQL date in the last 30 days.
Target benchmark: under 4 hours for high-volume inbound models. Under 24 hours for most mid-market teams. Under 48 hours as the absolute SLA threshold that triggers escalation.
If your MQL Velocity number is rising week over week, it is almost never a marketing problem. It is a process problem. Your campaigns are generating qualified leads. Your sales team is not picking them up fast enough. Without this report, you would see only that the pipeline is growing slowly and blame campaign performance. With it, you see exactly where the breakdown is.
The actionable threshold: Build a HubSpot workflow that fires when a contact becomes an MQL and has no logged activity from their assigned sales owner after 4 hours. The workflow sends a Slack or internal notification to the sales manager. This converts MQL Velocity from a weekly report observation into a real-time process alert. More than 64% of HubSpot automation users who configure process workflows like this exceeded their revenue targets in 2026, per Sona’s March 2026 HubSpot marketing statistics analysis.
Which HubSpot Reports Should You Delete? (The 60-Day Deletion Framework)
Every report in your HubSpot reporting setup that does not pass the Action-First test is producing noise. Noise reduces the signal quality of the reports that do pass. The natural instinct when a reporting setup is not working is to add more reports and more detail. The correct instinct is to delete reports until only the ones that drive weekly decisions remain.
| REPORT TYPE | STATUS | WHY |
|---|---|---|
| Email open rate (standalone) | DELETE | No lever. Opens dropping does not tell you what to change. Replace with email-to-meeting booked rate. |
| Total contacts in database | DELETE | Vanity metric. Growing database with no quality signal. Replace with MQL volume by source. |
| Website page views (solo) | DELETE | Lagging, disconnected. Only useful if you can trace page views to pipeline. Add context or remove it. |
| Social follower growth | DELETE | No revenue connection. Observation metric only. Remove from any revenue-facing HubSpot dashboard. |
| All campaigns performance (combined) | MOVE TO SANDBOX | Too broad for weekly action. Move to an ad-hoc analysis view. Keep quarterly review version only. |
| Revenue vs goal (with leading context) | KEEP | Passes Action-First test when paired with pipeline velocity data that explains the gap. |
The 60-day rule: any report that nobody has acted on in 60 days is either vanity, broken, or duplicated by another report. Run a HubSpot dashboard audit at the start of each quarter. List every report. For each one, ask the team member responsible: “What decision have you made based on this report in the last 60 days?” If the answer is none, move the report to a sandbox dashboard and observe whether anyone requests it back. In most teams, fewer than 30% of reports are requested back after being moved to the sandbox. The other 70% were noise the team had learned to ignore. Our content marketing team applies this same deletion discipline to content analytics, where the number of tracked metrics is inversely correlated with the number of decisions those metrics actually inform.
How Do You Fix Dirty HubSpot Data Before Fixing Your Reports?
A HubSpot reporting redesign built on dirty data will fail within 90 days. The team will open the new, action-first dashboards, see numbers they do not trust, and stop using them. Data quality is the prerequisite to reporting quality, not a parallel project. Run these three checks before rebuilding any HubSpot reporting setup.
Check 1: Lead source completion rate. In HubSpot reporting, run a contact count report segmented by Lead Source property value. If more than 15% of your contacts show “Unknown” or blank Lead Source, your attribution data is structurally broken. Every campaign attribution report you build on this foundation will be inaccurate. Fix the source capture at the form and workflow level before reporting on source performance.
Check 2: Deal stage definition consistency. If different sales reps are applying deal stages based on different definitions (one rep moves a deal to “Proposal” when they send a quote; another waits until the prospect confirms receipt), your deal stage duration and pipeline reports are measuring different things across different reps. This is not an HubSpot reporting problem. It is a process definition problem. Standardize the definitions in writing before building any funnel velocity reports that compare reps.
Check 3: Contact-to-company association rate. HubSpot reporting across the B2B funnel requires clean contact-to-company associations. If your contacts are not associated to their company records, deal attribution, account-level pipeline reporting, and company engagement reports will all be structurally broken. Run a contact count report filtered by “Company is unknown.” If this is above 10% of your active contact database, association cleanup is a prerequisite to actionable HubSpot reporting at the account level.
Frequently Asked Questions
Your HubSpot Data Is There. Your Team Just Needs Reports That Tell Them What to Do With It.
A2Z Dev Center runs HubSpot reporting audits that apply the Action-First test to every dashboard in your portal, rebuild role-based dashboards for sales, marketing, and RevOps, configure MQL Velocity and deal stage duration reports, and clear out the 60-day-no-action noise that is burying the signals your team actually needs.
Book a Free HubSpot Reporting Audit
Schedule a call
Talk to a subject-matter expert
Web development, SEO, or digital marketing — tell us about your project and we'll get back within one business day. No obligation.
- Free scope & strategy session
- A senior specialist, not a sales rep
- Your details stay confidential